Google Ads Quality Score is a keyword-level diagnostic scored 1–10 that estimates how relevant your ads are compared to other advertisers competing for the same searches. Higher scores typically lower your cost-per-click and improve your ad position without raising your bid. The fastest thing you can do right now: open your Keywords view in Google Ads, add the Quality Score columns, and find any component labeled “Below average.”
Quick orientation:
- Quality Score: 1–10 per keyword, updated based on historical performance and auction signals
- Three components: Expected CTR, Ad relevance, Landing page experience
- Each component status: Above average, Average, or Below average
- Ad Rank: Calculated using your bid, Quality Score, and expected impact of ad assets
- First action: Fix whichever component shows “Below average” first — that is where the efficiency loss is happening
Table of Contents
- What is Google Ads Quality Score, really?
- How does Google calculate Quality Score?
- Where can you find Quality Score in Google Ads?
- How does Quality Score affect your ad rank and CPC?
- How to raise your Quality Score: a prioritized checklist
- Common misconceptions about Quality Score
- How to monitor Quality Score and report it to stakeholders
- Ad-group and landing-page templates that lift relevance
- Key Takeaways
- The part most advertisers skip
- Tradewindsunitedmedia’s Google Ads audit for small businesses
- Useful sources and official documentation
What is Google Ads Quality Score, really?
Google describes Quality Score as a diagnostic tool, not a performance KPI. That distinction matters more than most advertisers realize. It tells you where your ads fall short relative to competitors on relevance — it does not tell you whether your campaign is profitable.
Think of it like a car’s check-engine light. The light does not tell you how fast you are going or how much fuel you have. It flags a specific system that needs attention. Quality Score works the same way: a score of 4 on a keyword means something in your ad experience is weaker than average for that search, and Google is showing you where to look.
The score lives at the keyword level. Each keyword in your account gets its own 1–10 rating based on how well your ads and landing pages serve users searching that term. Scores shift as you make changes, but they reflect historical data, so expect a lag of days to weeks before updates appear.
One thing Google does not expose in the UI: the full set of signals it uses. Device type, user location, time of day, search query context, and your account’s historical performance all feed into the auction-time calculation. What you see in the columns is a simplified snapshot, not the complete picture.
Google explicitly states that Quality Score should not be aggregated or treated as a primary KPI. Chasing a “good average QS” across your account misses the point. Use it to identify specific keywords and ad groups where relevance is broken, then fix those.
How does Google calculate Quality Score?
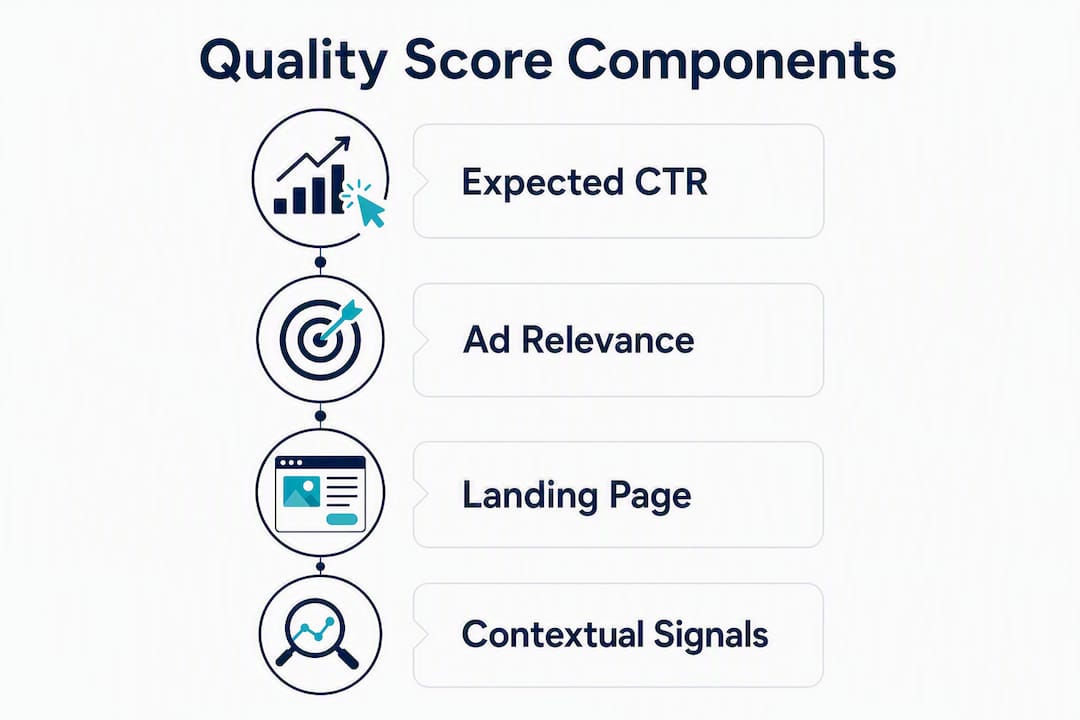
Three components drive the score, and each one gets its own status label in your account.

The three core components
| Component | What it measures | Estimated weight |
|---|---|---|
| Expected CTR | Likelihood your ad gets clicked when shown for this keyword | — |
| Ad relevance | How closely your ad copy matches the intent behind the keyword | — |
| Landing page experience | Relevance, transparency, and usability of the page users land on | — |
Practitioners commonly cite expected CTR as the component with the most weight and potential for improvement through ad copy testing, which is why most audits start there.
Each component is labeled “Above average,” “Average,” or “Below average” in the Keywords view. “Average” means you are roughly on par with competitors. “Below average” means Google’s data shows users are less satisfied with your ad or landing page than they are with competing ads for the same keyword.
Contextual signals Google uses but does not show
Beyond the three visible components, Google factors in device type, geographic location, the specific search query (not just the keyword), and your account’s historical performance. Match type also plays a role: exact-match keywords tend to produce cleaner Quality Score data because the query-to-keyword alignment is tighter. Broad match keywords can show inflated or deflated scores depending on which queries they are actually matching.
Ad assets (formerly extensions) like sitelinks, callouts, and structured snippets influence Ad Rank but are not directly reflected in the Quality Score columns. They still matter for overall auction performance.
Where can you find Quality Score in Google Ads?
Adding Quality Score columns takes about 90 seconds. Here is exactly how to do it.
- Sign in to your Google Ads account and navigate to Campaigns > Keywords > Search keywords.
- Click the Columns icon (the grid icon near the top right of the table).
- Select Modify columns.
- Under the Quality Score category, add: Quality Score, Exp. CTR, Ad relevance, and Landing page exp.
- Also add the historical versions: Qual. Score (hist.), Exp. CTR (hist.), Ad relevance (hist.), and Landing page exp. (hist.) — these let you track changes over time.
- Click Apply and save the column set for future use.
A dash (“—”) in a Quality Score cell means the keyword has not accumulated enough impressions for Google to generate a reliable score. Focus optimization effort on keywords that do have scores, especially those with “Below average” components and meaningful impression volume.
Segmenting and exporting:
- Use the Date range selector to compare Quality Score snapshots across periods.
- Apply the Device segment to check whether mobile or desktop is dragging down a component.
- Export the Keywords view to a CSV or Google Sheets for stakeholder reporting. The historical columns are especially useful here because they preserve a record even after you make structural changes.
For exact-match keywords, Quality Score data is usually the most reliable because the query matches the keyword precisely. Phrase and broad match keywords aggregate data across many different queries, so their scores can be harder to interpret.
How does Quality Score affect your ad rank and CPC?
Ad Rank is Google’s mechanism for deciding which ads show, in what order, and at what price. Your bid is only one input. Quality Score (specifically, the auction-time quality estimate it represents) multiplies against your bid to determine your position relative to competitors.

The practical result: a higher Quality Score lets you achieve the same or better position at a lower CPC. Improving a keyword’s Quality Score from a mid-level to a higher level typically reduces CPC by a significant margin at the same ad position.
High QS vs. low QS: what changes in practice
| Scenario | Quality Score | Bid required for top position | Likely outcome |
|---|---|---|---|
| Advertiser A | 8/10 | Lower | Top position, lower CPC, better impression share |
| Advertiser B | 4/10 | Higher | Lower position or higher spend for same placement |
| Advertiser C | 2/10 | Much higher | Ads may rarely show; budget depletes faster |
A low Quality Score does not just cost you money on individual clicks. It compounds: you burn budget faster, your impression share drops, and your conversion data accumulates more slowly, which makes smart bidding strategies less effective. Fixing a “Below average” landing page experience or Expected CTR issue is not just a relevance exercise — it directly affects how far your ad budget goes.
Quality Score is not the only auction input. Bid strategy, ad assets, competition level, and user context all play roles. But it is the input you have the most direct control over through account structure and creative decisions.
How to raise your Quality Score: a prioritized checklist
Work through these in order. The first items have the fastest impact; the later ones take longer but produce lasting gains.
-
Pull the Quality Score report. Filter keywords by “Below average” on any component. Sort by impressions descending. Start with the highest-traffic keywords — those have the biggest cost impact.
-
Tighten your ad groups. Industry best practice is to keep the number of closely related keywords per ad group moderate to maintain focus. If an ad group is too large and spans multiple intents, split it. Each cluster should have one clear theme that a single ad can address directly.
-
Separate branded from non-branded keywords. Branded keywords almost always have higher CTRs, which inflates the perceived performance of mixed ad groups and masks problems with non-branded terms.
-
Write ads that match the keyword’s intent exactly. Include the primary keyword in at least one headline. Use the display path to reinforce the topic. If the keyword is “emergency plumber Tampa,” the headline should say “Emergency Plumber in Tampa” — not “Plumbing Services Available.”
-
Test 3–5 ad variants per ad group. Pause underperformers after 500+ impressions — that threshold gives Google enough data to differentiate performance. Do not pause ads after 50 impressions; the data is too thin.
-
Add negative keywords. Irrelevant queries drag down Expected CTR because users see your ad and do not click. A tight keyword targeting strategy also reduces low-quality leads. Review the Search Terms report weekly and exclude anything that does not match your offer.
-
Fix landing page speed. Aim for a load time under 2.5 seconds. Use Google PageSpeed Insights to identify the specific issues. A page speed fix often produces one of the fastest improvements to Landing page experience scores.
-
Align the landing page message to the ad. If your ad says “Free Shipping on Orders Over $50,” that phrase needs to appear on the landing page, above the fold, immediately. Message consistency across ad copy and landing page is one of the highest-leverage factors for both Ad relevance and Landing page experience.
-
Optimize for mobile. Landing page experience is evaluated separately for mobile and desktop. A page that loads in 1.8 seconds on desktop but 5 seconds on mobile will show “Below average” for mobile users.
Timeline expectations by component:
- Ad relevance: updates in roughly 3–7 days after structural changes
- Expected CTR: stabilizes in approximately 2–3 weeks as new click data accumulates
- Landing page experience: typically takes 2–4 weeks for Google’s crawler to re-evaluate
Pro Tip: The single highest-leverage copy change for Expected CTR is usually the first headline. Most advertisers write generic first headlines (“Best Plumber in Tampa”) and specific second headlines. Flip that: put the most specific, benefit-driven phrase first. Users read the first headline first, and Google weights early engagement signals heavily.
Common misconceptions about Quality Score
Myth: Quality Score is the primary auction input.
It is one of several. Bid, ad assets, landing page relevance at auction time, and user context all factor into Ad Rank. A QS of 10 with a $0.01 bid will not beat a QS of 6 with a $50 bid in a competitive market.
Myth: A high Quality Score means high conversions.
Quality Score measures relevance and user experience, not conversion intent. You can have a QS of 9 on a keyword that never converts because the landing page has a broken form or the offer does not match what the searcher wants. Quality Score optimization and conversion rate optimization are separate loops — run them sequentially, not simultaneously.
Myth: Raising your bid fixes a low Quality Score.
Higher bids can temporarily buy position, but they do not change the underlying relevance signals. You end up paying more for the same inefficient ad experience.
Myth: You should track average account-level Quality Score as a KPI.
Google’s own documentation discourages this. Averaging QS across keywords with wildly different volumes and intents produces a meaningless number. A keyword with 50,000 impressions and a QS of 3 is a crisis; a keyword with 10 impressions and a QS of 7 is fine. Treat QS as a per-keyword diagnostic, not a campaign-level grade.
Structural mistake to avoid: Mixing branded and non-branded keywords in the same ad group. Branded terms inflate CTR, masking the underperformance of non-branded terms and making it harder to write ads that serve both intents well.
How to monitor Quality Score and report it to stakeholders
A Quality Score report is only useful if it connects score changes to cost and conversion outcomes. Here is what to track.
Key metrics for a QS report:
- Quality Score (hist.) per keyword
- Component statuses: Expected CTR, Ad relevance, Landing page experience
- Impressions and CTR
- Average CPC
- Impression share (lost to rank vs. lost to budget)
- Conversions and conversion rate
Reporting cadence:
- Weekly: Check for new “Below average” flags and review the Search Terms report for negative keyword opportunities.
- Every 4–6 weeks: Assess whether structural changes (ad group splits, new ad copy, landing page updates) have moved component statuses. This is the minimum window to see meaningful Quality Score shifts after systematic changes.
Practical dashboard tips:
- Save a filtered keyword view that shows only keywords with “Below average” on at least one component. Bookmark it. Check it every Monday.
- When you make a significant structural change (splitting an ad group, launching a new landing page), add an account annotation in Google Ads. Future reviewers — including you in six months — will understand why scores shifted on that date.
- Export historical QS columns to a Google Sheet monthly. Google Ads does not retain indefinite historical data in the UI, so a manual export creates a paper trail for client reporting.
Ad-group and landing-page templates that lift relevance
These templates reflect practitioner patterns for improving Ad relevance and Landing page experience scores. Use them as starting frameworks, not rigid rules.
Ad-group template examples
| Template | Keywords per group | Match-type mix | Headline pattern | Asset recommendation |
|---|---|---|---|---|
| Single-service local | 5–10 | Exact + phrase | “[Service] in [City]” / “Affordable [Service] [City]” | Location, call, sitelinks to service pages |
| Problem-solution | 8 | Phrase + broad match modifier | “[Problem]?” / “Fix [Problem] Fast” | Callout (“Same-day service”), structured snippet |
| Competitor-intent | 5–8 | Exact only | “Better than [Category]” / “Switch Today” | Price, promotion, review snippet |
Keep each ad group to one theme. Tight, themed ad groups are the most reliable structural fix for “Below average” Ad relevance.
Landing page checklist
- Headline match: The H1 on the landing page should echo the ad headline within 3–5 words.
- Visible promise above the fold: Whatever the ad offers (free quote, same-day service, 10% off), it must appear before the user scrolls.
- Remove distractions: Navigation menus, pop-ups, and unrelated offers all increase bounce rate and signal poor landing page experience.
- Mobile-first layout: Test on a real mobile device, not just a browser emulator.
- Speed goal: Under 2.5 seconds on mobile. Use professional page speed fixes if your CMS is the bottleneck.
- CTA above the fold: The primary action (call, form, buy) should be visible without scrolling on both desktop and mobile.
Before/after pattern: An ad group originally containing 22 keywords across “plumber,” “drain cleaning,” and “water heater repair” — all pointing to a generic homepage — typically shows “Below average” on both Ad relevance and Landing page experience. Split into three focused ad groups, each with a dedicated service page, and both components usually move to “Average” or “Above average” within two to three weeks.
Pro Tip: The fastest Ad relevance improvement usually comes from a single structural change: moving your top-performing keyword into its own single-keyword ad group (SKAG) or a very tight 2–3 keyword cluster, then writing an ad where that keyword appears in the first headline, the second headline, and the display path. Google’s relevance scoring responds to that level of alignment faster than almost any other change.
Key Takeaways
Quality Score is a keyword-level diagnostic that improves campaign efficiency when used correctly — fix “Below average” components first, then optimize conversions separately.
| Point | Details |
|---|---|
| Diagnose before you optimize | Open Quality Score columns and filter for “Below average” components before changing bids or budgets. |
| Tighten ad group structure | Keep 5–15 closely related keywords per ad group to improve Ad relevance scores. |
| Align ads and landing pages | Match the ad’s promise word-for-word on the landing page to lift both Ad relevance and Landing page experience. |
| Expect realistic timelines | Ad relevance updates in 3–7 days; Expected CTR in 2–3 weeks; Landing page experience in 2–4 weeks. |
| Tradewindsunitedmedia handles the full loop | Tradewindsunitedmedia audits QS components, restructures ad groups, and fixes landing pages as part of its Google Ads management service. |
The part most advertisers skip
Quality Score conversations almost always focus on the three components and the CPC savings. What gets skipped is the sequencing.
Most advertisers try to fix Quality Score and conversion rate at the same time. They rewrite ad copy, redesign the landing page, change the offer, and adjust bids simultaneously. Then they cannot tell which change moved the needle, and they end up reverting everything when conversions dip mid-test.
The smarter sequence is to treat Quality Score optimization as a distinct phase. Get your components to “Average” or better first. That reduces wasted spend and gives you cleaner data. Once your CPC is lower and your impression share is stable, then run conversion rate experiments on the landing page. You are now spending less per click, so each test costs less, and your data accumulates faster.
There is also a common misread of what “Average” means. Advertisers see “Average” on a component and assume it is fine. But “Average” means you are matching competitors, not beating them. In a competitive market, matching competitors on relevance while paying similar bids means the auction is essentially a coin flip. The accounts that consistently win top positions at lower CPCs are the ones that pushed components to “Above average” — and they did it through message specificity, not through higher bids.
The other thing worth saying: Quality Score is a lagging indicator. It reflects what Google has already seen, not what you just changed. Patience is not optional here. Make one structural change at a time, wait the appropriate window, and measure before making the next change. Stacking changes on top of each other is the fastest way to end up with no idea what worked.
Tradewindsunitedmedia’s Google Ads audit for small businesses
Running Google Ads without a Quality Score audit is like paying for a gym membership and only using the parking lot. The budget is flowing, but the efficiency gains are sitting untouched.

Tradewindsunitedmedia combines Google Ads campaign management with professional website design and landing page optimization — the two sides of Quality Score that most agencies handle separately, if at all. For small businesses, that separation is expensive: your ads agency improves CTR while your website stays slow and misaligned, and your Landing page experience score never moves.
The audit covers keyword-level Quality Score diagnostics, ad copy review, landing page speed, message alignment, and a restructuring recommendation for any ad groups with “Below average” components. You get a clear report showing exactly where your budget is leaking and what to fix first. Request a Google Ads quality audit to see where your account stands.
Useful sources and official documentation
- About Quality Score for Search campaigns (Google Ads Help) — the official definition, component descriptions, and Google’s guidance on how to interpret and use Quality Score. Start here.
- 5 ways to use Quality Score to improve your performance (Google Ads Help) — official Google documentation on practical applications; covers how to use component statuses to prioritize improvements.
- About ad quality (Google Ads Help) — explains the broader ad quality framework and how Quality Score fits within it.
- Three ways to improve your Quality Score (Google Ads) — Google’s own advertiser-facing guide covering the core improvement levers.