The Google Ads KPIs that matter most are the ones that connect ad spend to money in your bank account: conversions, cost per conversion (cost per lead or per sale), conversion value and return on investment. Click-through rate, cost per click, impressions and impression share are useful too, but they tell you why results are moving, not whether the campaign is paying for itself. This guide shows which numbers to watch, how to read them together, and how to set targets a small business can realistically hit.
TL;DR
- Judge your campaigns on business outcomes first: conversions, cost per lead or acquisition, and ROI. Treat CTR and CPC as health checks.
- There is no universal “good” CTR. Google says it depends on the product, service and network, so compare against your own history.
- Quality Score is a diagnostic on a 1-10 scale, not a performance KPI.
- Conversion tracking has to be right before any other number can be trusted.
- Set KPI targets before you launch, and review them monthly in a report you can explain in two minutes.
Table of Contents
- What Google Ads KPIs are and why a small business should track them
- The KPIs that tell you whether ads are paying off
- The health metrics: CTR, CPC, impressions and impression share
- Quality Score: a diagnostic, not a KPI
- How to choose KPIs by business type
- How to set realistic KPI targets
- Perspective: why we report outcomes first
- Building a Google Ads report you will actually read
- Common KPI mistakes to avoid
- Get a report that shows what your ad spend returns
- FAQ
- Sources
What Google Ads KPIs are and why a small business should track them
A metric is any number Google Ads reports. A KPI (key performance indicator) is the short list of metrics you have decided will tell you whether the campaign is doing its job. Google Ads reports dozens of metrics, from site behavior to auction insights and asset performance, according to the Google Ads API metrics reference. Nobody needs all of them on a dashboard.
For a small business the stakes are simple. Your budget is limited, so every wasted click is money you cannot spend elsewhere. A plumber paying for clicks from people looking for a free DIY fix, or a boutique paying for browsers who never buy, can look “busy” in the account while the phone stays quiet. KPIs are how you catch that early.
A useful way to organize them is in three layers:
- Reach and attention: impressions, impression share, CTR.
- Cost and traffic: clicks, average CPC.
- Business results: conversions, conversion rate, cost per conversion, conversion value, ROI.
The layers read from top to bottom like a funnel. When the bottom layer is healthy, you can mostly ignore the top. When it is not, the top layers help you find the leak.
The KPIs that tell you whether ads are paying off
Conversions and conversion tracking
Everything starts here. Google describes conversion tracking as measuring valuable customer actions such as purchases, sign-ups or leads, and as the foundation for judging ROI, in its guidance on using data to optimize Search campaigns. If the account counts the wrong actions, every ratio built on top of it is wrong.
For a local service business, a conversion is usually a phone call, a form submission or a booked appointment. For a retailer it is a purchase. Decide which actions count, and give each one a sensible weight. A completed quote request is worth more than a brochure download.
If you take payment or close deals offline, standard tracking misses the part that matters. Our guide to fixing offline conversion tracking with enhanced conversions covers how to feed real sales back into the account, and our walkthrough on setting up Google Ads conversion tracking covers the basics.
Conversion rate
Conversion rate is conversions divided by clicks (or interactions). It answers one question: of the people who paid to visit, how many did what you wanted?
Low conversion rate with healthy CTR points away from the ad and toward the landing page, the offer or the phone-answering process. A page that loads slowly, buries the phone number or asks for ten form fields will waste good clicks. This is where website design and advertising overlap, and why we treat them as one system.
Cost per conversion: cost per lead or cost per acquisition
Google defines cost per conversion as the amount you spend for each conversion, and notes that tracking it helps you judge whether a keyword or ad is profitable, in its page on return on investment. For lead generation this is your cost per lead (CPL). For ecommerce or booked jobs it is cost per acquisition (CPA).
Here is a worked example with made-up round numbers, to show the logic and not a benchmark:
- You spend $1,500 in a month and get 30 form leads. Cost per lead: $50.
- You close 6 of those leads into jobs. Cost per acquired customer: $250.
- The average job brings in $900 in revenue at a 40% margin, so $360 gross profit.
- Profit after ad spend per customer: $110. The campaign works, but with little room for error.
Notice that the $50 CPL alone tells you nothing. Only when you add close rate and margin do you know whether $50 is cheap or ruinous.
Conversion value, ROAS and ROI
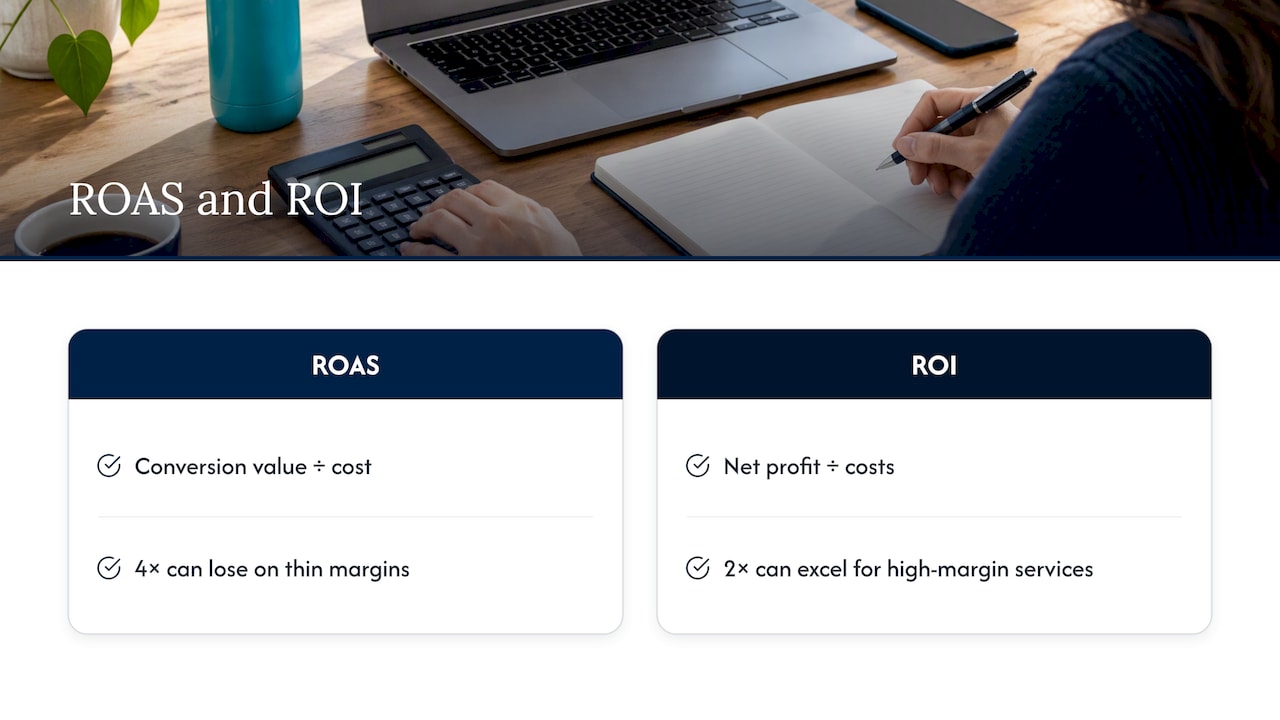
Return on ad spend (ROAS) is conversion value divided by cost. It is the natural KPI when each sale has a different dollar amount, such as an online store.
ROI goes one step further. Google calls ROI typically the most important measurement for an advertiser, calculated as net profit divided by costs, in the same ROI guidance. The difference matters: a 4x ROAS on a product with a thin margin can still lose money, while a 2x ROAS on a high-margin service can be excellent.
The same page suggests measuring profit contribution at campaign level and splitting acquisition costs by lead quality or product margin. In practice, that means tagging which leads turned into customers and which were junk, then looking at cost per good lead. Google’s help center also describes assigning values based on business KPIs such as lifetime value and profit, which is how the account learns what a high-value customer looks like.
The health metrics: CTR, CPC, impressions and impression share
These metrics sit in the top two layers. They will not tell you whether you are profitable, but they flag trouble fast. Search Engine Land’s Kevin Rea describes fundamentals such as impressions, clicks and average CPC as the first line of defense for spotting sudden disruptions. Search Engine Journal’s Brooke Osmundson makes a similar point about reporting: CTR and CPC help diagnose friction, but they are health metrics rather than outcomes for executive reports.
What is a good CTR in Google Ads?
CTR is clicks divided by impressions: the share of people who saw your ad and clicked it. Google is direct about the benchmark question. There is no single good CTR; it depends on the product, service and network where the ad runs. Google also notes that a higher CTR generally suggests people find your ads helpful and relevant, per its CTR definition.
So instead of chasing a number from a blog post, use these comparisons:
- Your own trend. Is CTR rising or falling against the last three months?
- Campaign against campaign. Branded searches (people typing your business name) will have a much higher CTR than broad service searches. Never average them together.
- Ad against ad. Within one ad group, a headline that earns a clearly higher CTR at the same conversion rate is a winner.
- Network against network. Search, Performance Max and display placements behave differently, so read them separately.
A CTR that is high with a poor conversion rate can even be a warning. It may mean the ad promises something the page does not deliver, or attracts the wrong crowd. Our write-up on responsive search ads explains how ad copy testing can lift clicks without changing who clicks.
Average CPC
Average CPC is cost divided by clicks. It rises with competition, and it depends on your bids, ad relevance and landing page experience. A rising CPC is not automatically bad: if cost per lead stays flat because conversion rate improved, you are fine. A rising CPC with a falling conversion rate is the combination to act on. For the budget side of this, see our breakdown of what Google Ads costs small businesses.
Impressions and impression share
Impressions count how often your ad appeared. Impression share shows the percentage of eligible impressions you actually received, and the lost share is split between budget and ad rank. That split tells you what to do:
| Signal | Likely cause | First move |
|---|---|---|
| Impression share lost to budget is high, and cost per lead is good | Budget is capping a profitable campaign | Raise budget gradually |
| Impression share lost to budget is high, and cost per lead is poor | Budget is being spent on weak traffic | Fix targeting and keywords before adding money |
| Impression share lost to rank is high | Bids or ad quality too low for the auction | Improve ads and landing pages, then review bids |
| Impressions drop suddenly, nothing changed | Disapproved ads, billing issue, or paused campaign | Check account status and policy notices |
The rule is to read these metrics together. Impressions up, CTR down means you are showing for broader searches. Clicks up, conversions flat means traffic quality dropped. Our Google Ads budget guide goes deeper on when more spend makes sense.
Quality Score: a diagnostic, not a KPI
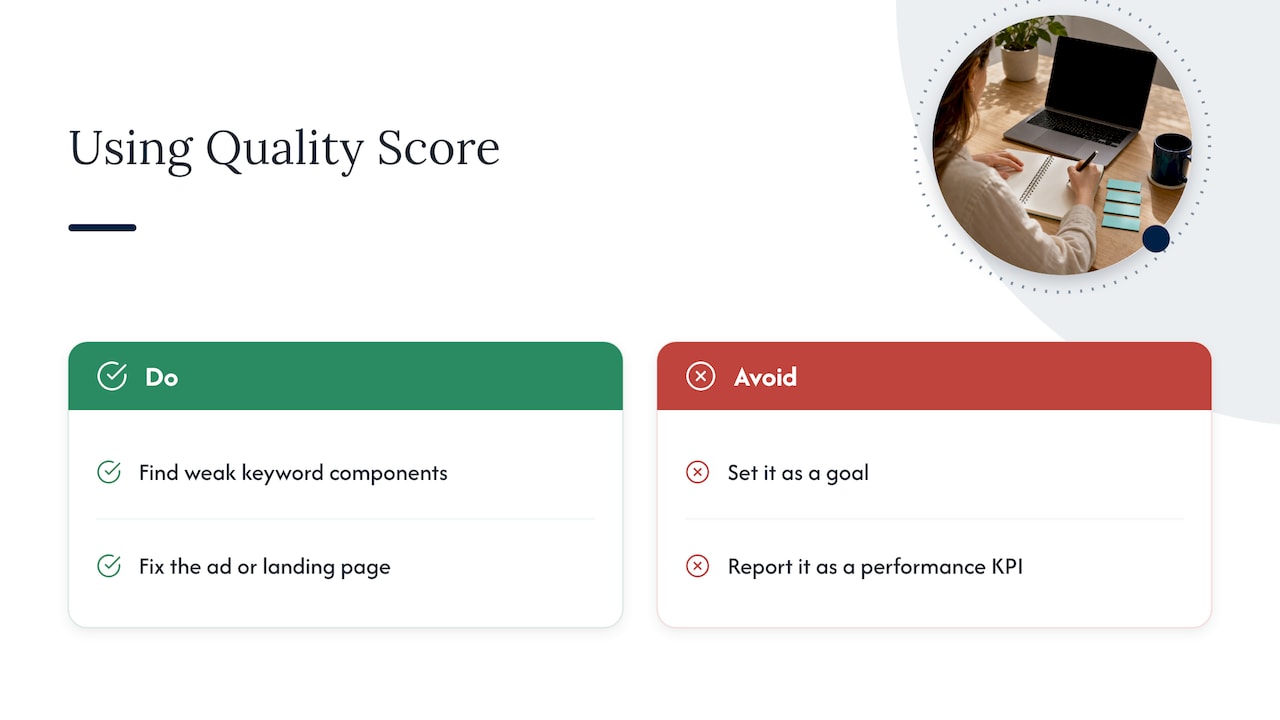
Quality Score is a 1-10 rating that compares your expected CTR, ad relevance and landing page experience to other advertisers. Google’s own page on Quality Score for Search campaigns positions it as a diagnostic tool and says it should not be treated as a performance KPI. That surprises many owners, because a low score feels like a failing grade.
The practical reading: use Quality Score to find which keywords have weak components, then fix the ad or page. Do not report it to your boss or yourself as a goal. A keyword with a Quality Score of 5 that produces cheap, closed leads beats a 9 that produces nothing. When you want to work on the components, start with our guide to improving Quality Score and cutting CPC.
Site behavior numbers such as bounce rate deserve the same caution. They help you spot a bad landing page, but not all visits are human, and automated visitors are one more reason to question them. This look at AI agents visiting your website shows how easily that kind of traffic goes unnoticed.
How to choose KPIs by business type
The right short list depends on how you make money. Start from the sale, not from the dashboard.
| Business | Primary KPIs | Supporting metrics |
|---|---|---|
| Local service provider (HVAC, legal, dental) | Qualified leads, cost per qualified lead, cost per booked job | Call volume, conversion rate, impression share |
| Retailer or ecommerce shop | Conversion value, ROAS, profit after ad spend | CTR, CPC, cart conversion rate |
| Appointment-based business | Booked appointments, cost per appointment, show rate | Form completion rate, call duration |
| Higher-ticket B2B | Cost per sales-qualified lead, pipeline value | Lead-to-close rate, CPC |
If you are generating leads, the metric to anchor on is cost per lead, with a quality filter. Count a lead only when it is a real prospect in your service area asking for what you sell.
How to set realistic KPI targets
Google advises aligning on test goals and KPIs before launching campaigns so that you can measure the business outcome you want, in its campaign performance guidance. That sounds obvious, and it is skipped constantly. Here is a process that works for small accounts.
- Work backward from profit. Take your average sale, your gross margin and your close rate. Decide how much you can pay for a lead and still earn what you need. That is your ceiling for cost per lead.
- Set a launch hypothesis, not a promise. Early weeks are for learning. Expect the first month to be noisy, with small samples and automated bidding still calibrating.
- Pick one primary KPI per campaign. Cost per qualified lead for service campaigns, ROAS or profit for product campaigns.
- Add two or three guardrails. For example, conversion rate should not fall below your starting point, and impression share lost to budget should stay low on your best campaigns.
- Use your own baseline. After 60 to 90 days you have your own CTR, CVR and CPL. Improve those by steady steps instead of chasing someone else’s averages.
- Review on a fixed rhythm. Weekly glance for anomalies, monthly review for decisions, quarterly review for strategy.
If you want a lighter weekly routine, our marketing KPIs for small businesses piece lays out a 15 to 30 minute check you can run yourself.
Perspective: why we report outcomes first
Most owners who come to us after a bad agency experience describe the same thing: a report full of impressions, clicks and a cheerful CTR, and no clear answer to “how many customers did this bring me?” We think that is backward. The report should lead with leads, cost per lead and what those leads became, then use CTR, CPC and impression share to explain the movement.
We also think a KPI that cannot change a decision is clutter. If a number drops and you would do nothing differently, take it off the page. And we would rather tell you a campaign needs a better landing page than raise your budget to hide the problem. That is why we pair ad management with website design and local visibility work: the click is only the middle of the customer’s journey.
Our approach is data-driven reporting with regular updates, so you always see what your spend produced and what we plan to change next.
— Michael
Building a Google Ads report you will actually read
A good monthly report for a small business fits on one page and answers five questions:
- How much did we spend, and how does that compare to the plan?
- How many conversions came in, and which campaigns produced them?
- What did each lead or sale cost?
- How many of those leads were real customers, and what was the revenue or profit?
- What are we changing next month, and why?
Put outcomes at the top, health metrics in a small supporting table, and a short note on what changed. Compare to the previous month and the same month a year ago if you have it, because seasonality can fool you. A landscaper’s January will never look like June.
Be careful with attribution too. Calls, map listings and organic search can all be part of the same customer’s path. If your ads look expensive, check whether your Google Business Profile and website are converting the demand the ads create. For deciding where the next dollar belongs, see how to split budget between SEO, Google Ads and social media, and if you are still weighing channels, Google Ads versus Facebook Ads.
Common KPI mistakes to avoid
- Optimizing for clicks. Cheap clicks are only cheap if they convert.
- Counting every conversion equally. A page view and a signed contract are not the same event.
- Ignoring lead quality. Without feedback on which leads closed, automated bidding optimizes for volume of form fills, including junk.
- Reading metrics in isolation. A high CPC may be fine with a strong conversion rate. A low CPC may be a trap.
- Changing too much at once. If you edit bids, ads and landing pages in the same week, you will not know what worked.
- Judging too soon. A few clicks a day is a small sample. Wait for enough data before concluding.
- Chasing benchmarks. Industry averages describe other advertisers’ markets, not your service area and your margins.
If you have ever wondered whether the whole channel is worth it, our article on whether Google Ads is a money pit or a lead-generation machine answers it with these same measurements.
Get a report that shows what your ad spend returns
If your current reports leave you guessing, we can help. Tradewinds United Media manages Google Ads campaigns for small and local businesses, builds the websites those clicks land on, and sends clear performance reports with regular updates so you can see what your investment produced. Get in touch and we will start with your numbers, not a sales pitch.
FAQ
What are the most important Google Ads KPIs?
For most small businesses: conversions, cost per conversion (cost per lead or acquisition), conversion rate and ROI or ROAS. CTR, CPC, impressions and impression share support those by showing where a problem sits. Pick one primary KPI per campaign and keep the rest as context.
What is a good CTR in Google Ads?
Google says a good CTR depends on the product, service and network, so no single figure applies to everyone. Compare your CTR with your own past results, between campaigns of the same type, and between ads in the same ad group. Always check it next to conversion rate, because clicks that never convert do not help.
Is Quality Score a KPI?
No. Google describes Quality Score as a diagnostic tool that shows how your ad quality, relevance and landing page experience compare with other advertisers. Use it to find weak keywords and pages, but measure success by conversions, cost per conversion and profit.
How long before I can judge Google Ads KPIs?
Give a new campaign several weeks of data before drawing conclusions, and longer if you get only a handful of clicks or leads per week. Small samples swing wildly. Review weekly for anomalies, and make strategy decisions on monthly and quarterly trends.
Sources
- Metrics | Google Ads API | Google for Developers
- Use data to optimize your Search campaigns – Google Ads Help
- About return on investment (ROI) – Google Ads Help
- Clickthrough rate (CTR): Definition – Google Ads Help
- About Quality Score for Search campaigns – Google Ads Help
- Demand Gen campaign performance guide – Google Ads Help
- How to analyze PPC performance metrics – Search Engine Land
- The 8 Most Important PPC KPIs You Should Be Tracking – Search Engine Journal